Reference
Modified Oxygen Defect Chemistry at Transition Metal Oxide Heterostructures Probed by Hard X-ray Photoelectron Spectroscopy and X-ray Diffraction
I. Inorganic Chemistry
Reference
- Modified Oxygen Defect Chemistry at Transition Metal Oxide Heterostructures Probed by Hard X-ray Photoelectron Spectroscopy and X-ray Diffraction
- Elemental Core Level Shift in High Entropy Alloy Nanoparticles via X-ray Photoelectron Spectroscopy Analysis and First-Principles Calculation
- Electronic Structures of Pt−Co and Pt−Ru Alloys for CO-Tolerant Anode Catalysts in Polymer Electrolyte Fuel Cells Studied by EC−XPS
- Lattice Strain Formation through Spin-Coupled Shells of MoS2 on Mo2C for Bifunctional Oxygen Reduction and Oxygen Evolution Reaction Electrocatalysts Adv. Mater. Interfaces 2019, 6, 1900948
- Hydrogen-Intercalation-Induced Lattice Expansion of Pd@Pt Core–Shell Nanoparticles for Highly Efficient Electrocatalytic Alcohol Oxidation J. Am. Chem. Soc. 2021, 143, 11262−11270
- Lattice Strain Induced by Linker Scission in Metal–Organic Framework Nanosheets for Oxygen Evolution Reaction ACS Catal. 2020, 10, 10, 5691–5697
- Tailoring the d-Band Centers Enables Co4N Nanosheets To Be Highly Active for Hydrogen Evolution Catalysis Angew.Chem.Int.Ed.2018,57,5076–5080
1. XPS
Why does XPS metal spectrum contain two main peaks, M 2p1/2 and M 2p3/2 ?
They correspond to different spin–orbit couplings of metal (spin−orbital peaks)
What does satellite peaks assign to?
It assigns to the extra electrons transferred from the organic element (Oxygen, in most case) 2p orbitals to the Metal 3d orbital. These electrons screen the electric field of the holes in the Metal 2p orbital created during the photoelectron emission process
Can we learn something from satellite peaks?
The shape and position of the satellite peaks are widely used to identify the valence state of Metal. Giving Cobalt as example, there is no evidence that the ratio of satellite peaks (Coss2+/Coss3+) increases linearly with the Co2+/Co3+ ratio. However, it is known that higher peak intensity for the Co2+ satellite arises from a higher Co2+ content, and similarly for the Co3+ case, even if the ratio of satellite peak intensities does not have to be linear.
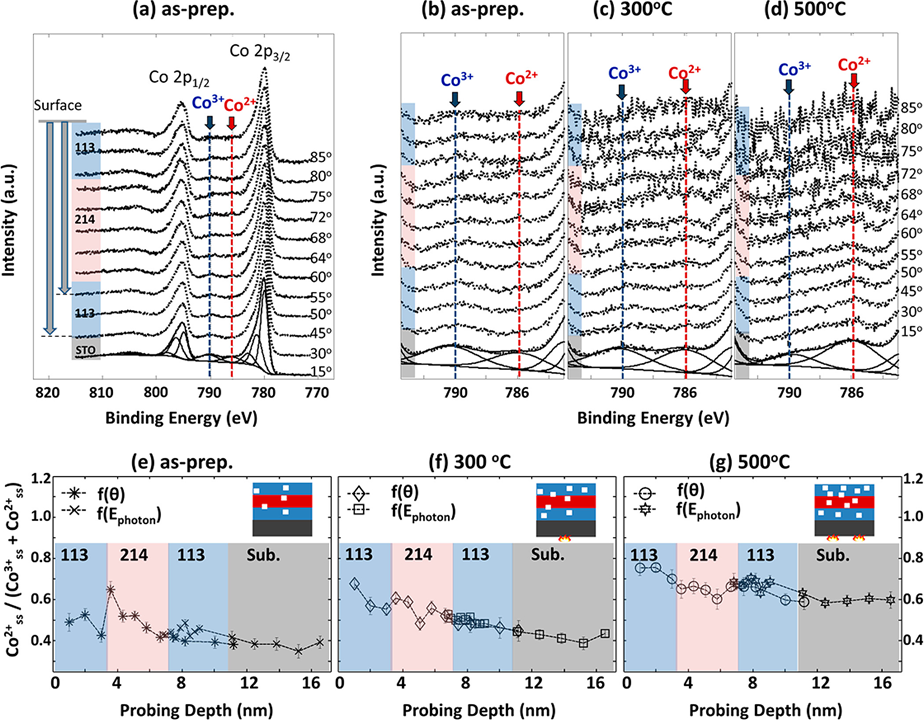
Figure 1. An example from reference [Chem. Mater. 2018, 30, 10, 3359–3371]
What does positive shift (shift to higher binding energy) in XPS mean?
In general, a positive XPS shift of an atom has been interpreted by an electron loss of the atom. In the case of M-X inorganic-organic semiconductor, if XPS of M shift to higher binding energy, and X shift to lower binding energy, that means another element (usually inorganic N) is incorporated into M-X structure, indicating the increased electron cloud density around X sites in N-MX. Such observations can be ascribed to the fact that N with multiple valences can manipulate the valence state and electronic structure of M element, making electron-rich M transfer electrons to X. In consequence, M loses electrons leading to higher binding energy, whereas X acquires electrons generating lower binding energy.
It can be due to the hydrogenzation to convert M into MHx (metal hydride).
What does negative shift (shift to lower binding energy) in XPS mean?
In the case of M-X inorganic-organic semiconductor, an XPS shift to lower binding energy of M element could be assigned to new chemical bonding M-Y, in which the organic Y exhibits higher electronegativity in comparing to X.[Adv. Mater. Interfaces 2019, 6, 1900948].
Another reason is that: a decrease of binding energy could be mainly resulted from the lattice expansion of the M lattice structure, which can lead to the upshift of d-band center.[J. Am. Chem. Soc. 2021, 143, 11262−11270]
What if XPS peak of M1 positive shift while XPS peaks of M2 negative shift?
Given example of NiFe-MOF, Ni shows positive shift and Fe shows negative shift. This change is identified to be because of the partial Ni-to-Fe electron transfer caused by lattice strain under steady-state conditions, which leads to more empty Ni 3d orbitals and more Fe 3d electrons in the LS-NiFe-MOFs
What can we learn from any change in full width at half maximum (FWHM)?
In the case of M’s FWHM increase while X’FWHM decrease, it would indicate to spin coupling between M and X.
How to explain the shift of XPS peak according to work function of elements?
There are 2 school of thoughts: (1) the conventional explanation: XPS shift would follow the order of work function;[J. Electrochem. Soc.1995, 142, 1409],[J. Phys. Chem. B2002, 106, 1869] and (2) 2nd explanation in [J. Phys. Chem. B, Vol. 110, No. 46, 2006]
In comparison between pure Pt and the alloys, the conventional explanation conflicts with the order of the work functions. In view of the order (Pt > Ru > Co), the electron transfer must occur from Ru or Co to Pt atom. Furthermore, it has been reported in theoretical studies that the total number of electrons per a Pt atom increased while the 5d electron decreased when the Pt atom was alloyed with a second component. An alternative explanation for the positive Pt 4f7/2 CL shift in XPS measurements should be made by the difference in work function between pure Pt and the alloy, accompanied by rehybridization of the d-band as well as the sp-band. The work function change leads to the reference level (EF) shift in photoelectron measurement. Such a change in the work function, i.e., upshift of the reference level, results in an opposite downshift of Pt 4f7/2 CL as well as the d-band center, as illustrated schematically in Figure 2. The theoretical CL shift for an alloy can be calculated as a function of the alloy composition by applying the Z + 1 approximation of the final state and Born−Haber cycles with the enthalpy for the alloy formation, which can be evaluated from work functions and electron densities at the boundary of a Wigner−Seitz cell of the pure elements
J. Phys. Chem. B, Vol. 110, No. 46, 2006

Figure 2. An example from reference [J. Phys. Chem. B, Vol. 110, No. 46, 2006]
[Cont.] During electrochemical stabilization, the Co dissolution from the alloy and the formation of the Pt skin layer, or at least Pt-rich layer, on the electrode surface. Why XPS peak of Pt shift to lower binding energy?
This unexpected value of the CL shift is probably due to a particular surface structure after the stabilization, leading to an extra effect on the electronic structures of Pt beyond the component concentration. For example, Co impurity seeded in the Pt skin layer is one of the possible explanations for the extra CL shift due to a strain.

Figure . Area-normalized CL spectra of Pt 4f7/2 for Pt58Co42 as prepared (solid line) and after stabilization (dashed line). The pure Pt CL spectrum is represented by a dotted line for comparison
Why does Metal XPS peaks up-shift (i.e., to lower binding energy) after annealing at high temperature (e.g., 500 oC)?
If the Metal film is reduced, formation of oxygen vacancies induce defect states and shift the valence band edge up. The higher upshift, the more significant reduction of Metal.
What if some inorganic elements present upshift and others exhibit downshift, especially in High Entropy Alloy (HEA)?
These effects can be conceptualized as interatomic electron transfer between the materials, and relaxation effects arising from core-hole screening around the atom. Thus, it is likely that, during the HEA-NP formation in a quinary-metal system, some of the metal atoms act as electron acceptors (negative shift) or electron donors (positive shift) to the other metals
2. VB (Valence Band) XPS
Case I: Pt and its alloy

Figure 3. Area-normalized VL spectra[J. Phys. Chem. B 2006, 110, 46, 23489–23496]
In the case of pure Pt, the VL spectrum exhibits a steep edge at EF followed by a shoulder peak at 2.0 eV and a characteristic peak at 4.2 eV as indicated by thin vertical lines in Figure 3. The electronic structures of the alloys are apparently different from that of pure Pt. The VL spectra for both alloys exhibit dull edges and tailed peaks (reduced electron density at EF and valence band broadening), which strongly suggests the positive shift of Pt 5d band center from that of the pure Pt
Case II: Dope V into Co4N
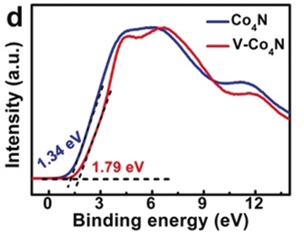
Figure. Valence-band spectra of Co4N and V-Co4N[Angew.Chem.Int.Ed.2018,57,5076–5080]
The valence band maximum values are determined to be approximately 1.34 eV for Co4N and 1.79 eV for V-Co4N, respectively. Clearly, the valence band is shifted away from the Fermi level after V doping. Since the valence electrons close to the Fermi level mainly contribute the d states, the shift of the valence band implies the d-band center of V-Co4N also shifts compared to that of Co4N.
II. Organic Chemistry
Reference
- Can We Identify the Salt–Cocrystal Continuum State Using XPS?
- Proton Transfer on the Edge of the Salt/Cocrystal Continuum: X-Ray Photoelectron Spectroscopy of Three Isonicotinamide Salts

Leave a comment