Case 1: Antiferromagnetic Cobalt Oxide Nanooctahedra
The organic−inorganic interface determines the crystalline growth directions of the nanoparticles by means of a dynamic solvation of these surfactants in solution, which generally contain electron-donating groups to allow coordination to electron-poor metal atoms at the nanocrystal surface.
Nano Lett. 2014, 14, 2, 640–647
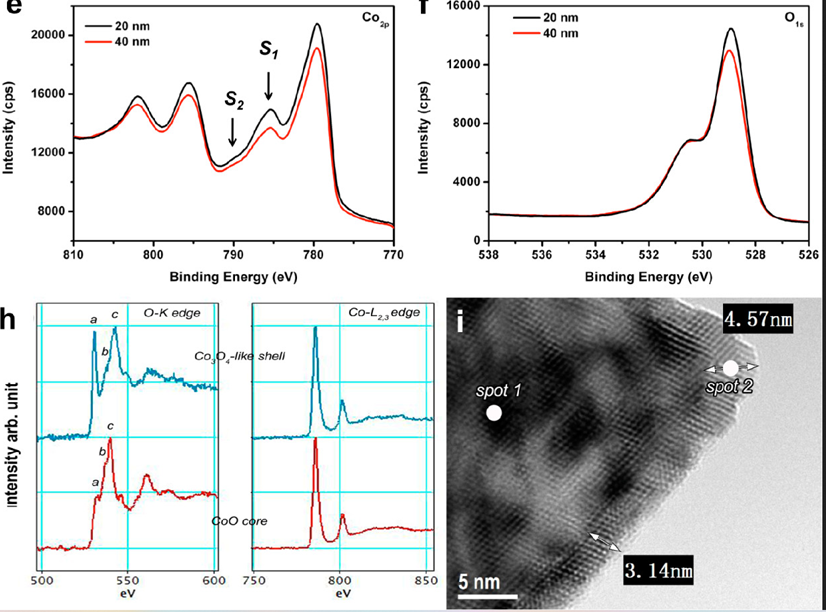
Figure 1. EEL spectra (h) at the O-K and Co-L edges recorded in the core (spot 1) and shell (spot 2) regions of the
octahedron as indicated in the TEM image (i)
At the O K-edge, the peaks labeled as a, b, and c arise from the electron transition from O 1s → 2p states hybridized with Co unoccupied 3d, 4s, and 4p orbitals, respectively. Relative intensities and energies of the peaks a, b, and c allow to discriminate Co-oxide phases (CoO or Co3O4). In O K-edge data, the high intensity of the prepeak a recorded in the shell region (spot 2) is indicative of Co3O4, while in the one from spot 1 in which the intensity of the prepeak a is low is typical for the CoO phase. The white line ratio of the Co L3 to L2 edge intensities in the two regions is 4.32 and 4.35, respectively. In comparison to the bulk reference ratios, 4.51 for CoO and 2.42 for Co3O4, this would suggest that the atomic Co electronic structure in the core and shell region is the same and similar to CoO (Co2+ state). Because the CoO presence in the shell can be unambiguously excluded from high-resolution transmission electron microscopy (HRTEM) and XPS results, we attribute this unexpected Co L3/L2 ratio in the shell region to a structurally distorted, nonstoichiometric, and/or defective phase Co3O4-like phase. This could explain the high intensity of prepeak a in O K-edge and the satellite peak S2 in the XPS Co 2p spectra, but approximately the same L3/L2 ratio for the core and shell regions
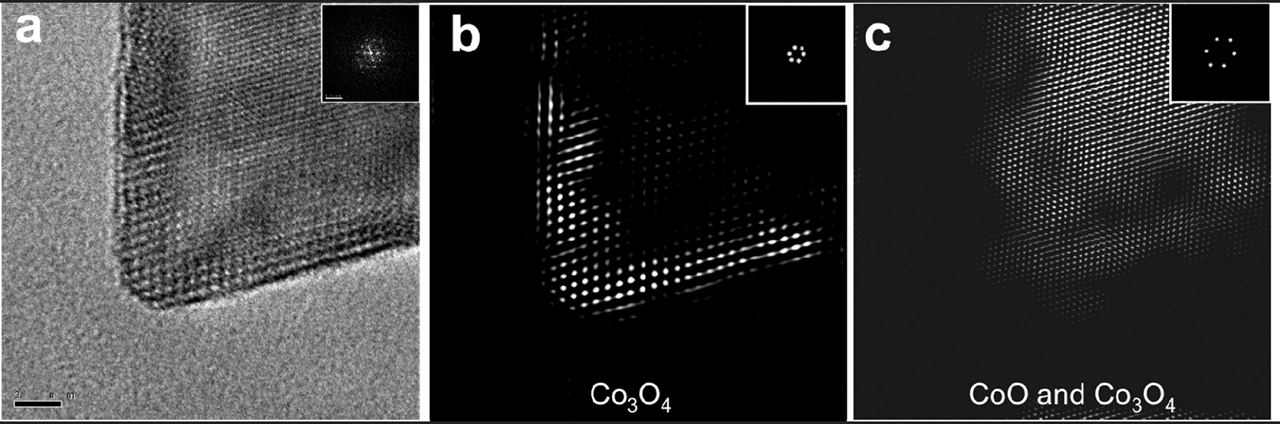
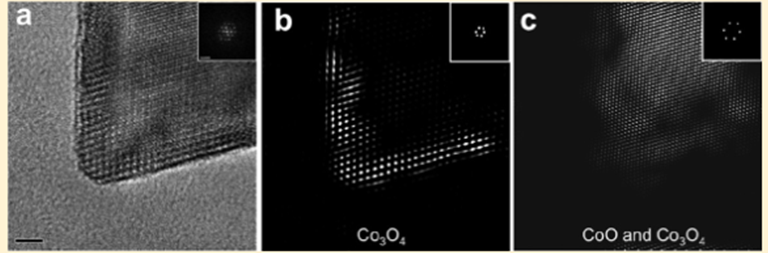
Figure 2. HRTEM image (scale bar: 2 nm) of an octahedron showing core and shell areas with different contrast (a). Fourier filtering of this TEM image using frequencies that correspond only to Co3 O 4 planes (b) and using frequencies that correspond both to Co 3 O4 and to CoO (c). Insets demonstrate the Fourier transform of each of the images.
Because the particles present a nearly perfect octahedron shape and are oriented along their zone axes, the contrast variation in the shell arises from changes in scattering condition due to the core/shell structural overlay. The existence of the shell with a different crystalline lattice is demonstrated by the Fourier filtered images shown in Figure 2b,c. In Figure 2b, we show an image that is the result of the Fourier filtering of the TEM image in Figure 2a, using the spots or frequencies that are exclusive for the Co3O4; while in Figure 2c the filtering was done using the spots that are due both to Co3O4 and CoO. This provides convincing evidence for the presence of two different lattices; CoO in the core region and Co3O4 spinel-like phase in the shell. No planar defects such as twinning or stacking faults are detectable. The hypothesis of local strain is also supported in these atomically resolved images on which the black patches display better the crystalline lattice than the bright ones.

Ethan Savette
Product Designer at Idea, Ethan’s work has been featured as pioneer in CX as best practice.
Ray Cordova
UX Manager at Clockwork. He formerly pioneered the Design System at Blue Sun, and led the Moonlight at Wonders and Co.

Leave a comment