Case 1: Cobalt oxide in Li-Battery

Figure 1. Electrochemical properties of the multi-shelled cobalt oxide yolk–shell powders post-treated at various temperatures: (a) Initial discharge and charge curves, (b) and (c) CV curves, and (d) cycling performances.[Nano Research 2014, 7(12): 1738–1748]
Figures 6(b) and 6(c) show the cyclic voltammograms (CVs) of the two samples post-treated at 300 and 400 °C for the first five cycles obtained at a scan rate of 0.07 mV·s–1. The CV profile of the cobalt oxide powders post-treated at 300 °C for the first discharge process showed two reduction peaks at 0.86 and 0.65 V. The reduction peak observed at 0.86 V is associated with the conversion reaction between Co3O4 and Li, whereas the reduction peak observed at 0.65 V attributed to the conversion reaction between CoO and Li. The CV profile of the phase pure Co3O4 powders post-treated at 400 °C showed one sharp reduction peak at 0.84 V in the first discharge process. In subsequent cycles, the reduction peaks of the powder post-treated at 300 and 400 °C shifted to 1.1 V because of the improved kinetics of the electrode due to the formation of ultrafine nanoclusters after the first cycle. The oxidation peaks of the powders also shifted slightly to 2.1 V after the first cycles. The Co3O4 transformed into Co metal nanograins and amorphous Li2O during the first discharging process, and then the reversible conversion reactions between CoO and Li occurred from the second cycles. Therefore, only one reduction peak remains after the first cycle for the Co3O4 yolk–shell powders post-treated at 300 °C.
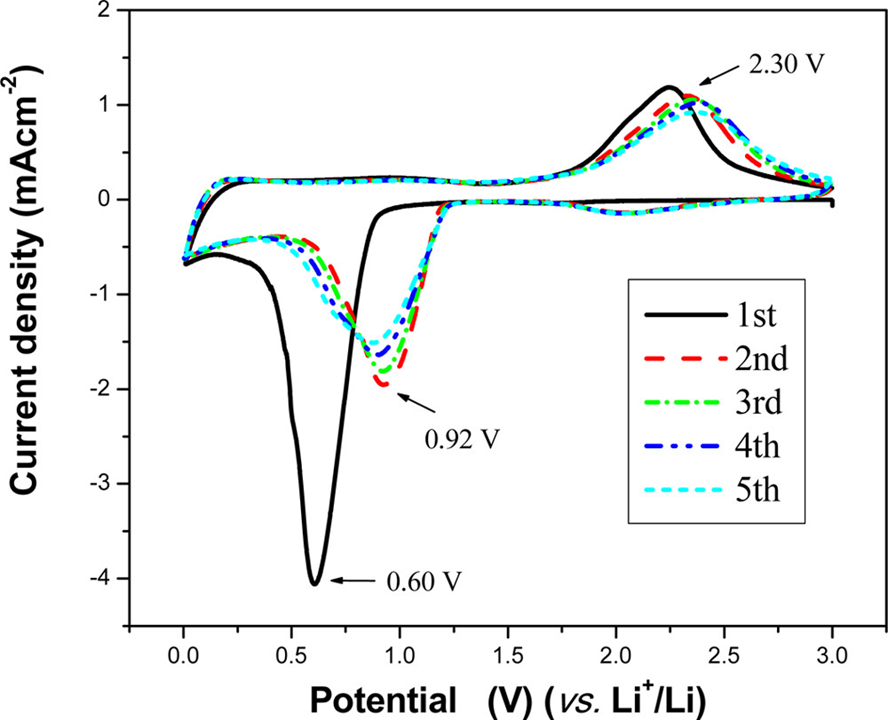
Figure 2. First five cyclic voltammogram curves of Co3O4 electrode at a scan rate of 0.2 mV·s–1 in the range of 0.01–3.00 V.[ACS Appl. Mater. Interfaces 2014, 6, 10, 7236–7243]
At the first cycle, only a well-defined reduction peak is observed at about 0.60 V, which may be caused by the initial irreversible reduction reaction of Co3O4 to Co [eq 1]; and an obvious anodic peak is recorded at about 2.24 V, which could arise from the oxidation reaction of Co to CoO [eq 2]. In the subsequent cycles, the reduction peaks are shifted to 0.86–0.92 V, which corresponds to the other reduction reaction of CoO to Co [eq 3], but the oxidation peaks are observed at 2.24–2.36 V with a little change corresponding to the same oxidation reaction [eq 2]. It indicates that the electrochemical reaction is excellent reversible after the first cycle. In addition, the intensity of reduction peaks decreases after the second cycle due to the formation of the irreversible solid electrolyte interface (SEI) film and the irreversible reduction reaction.
 (1)
(1)
 (2)
(2)
 (3)
(3)
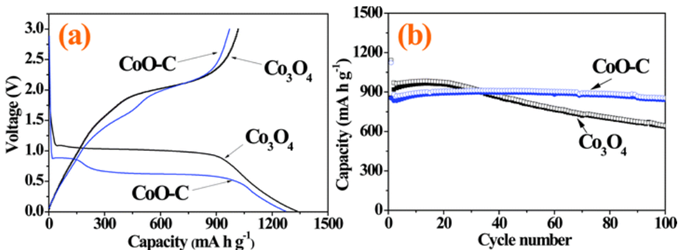
Figure 3. Electrochemical properties of the Co3O4 and CoO–C composite powders: (a) initial charge and discharge curves at a constant current density of 500 mA g−1, (b) cycling performances at a constant current density of 1400 mA g−1 [Nanoscale, 2014, 6, 4789-4795]
The Co3O4 electrode exhibits a long plateau region in the initial discharge profile at a voltage of ca. 1 V, corresponding to lithium insertion into the crystal structure of Co3O4 and reduction of the Co ions to the Co metal. On the other hand, three distinct regions were observed in the initial discharge profile of the CoO–carbon composite electrode. The first plateau appearing at 0.9 V is associated with lithium storage in CoO.53 The second plateau located at 0.6 V can be ascribed to the conversion reaction between CoO and Li. The slope, which is observed in the voltage range between 0.5 and 0.01 V, may be attributed to the interaction of Co particles with the electrolyte to form a solid electrolyte interface layer. The initial discharge capacities of the Co3O4 and CoO–carbon composite powders were 1334 and 1273 mA h g−1, respectively. These values are much higher than the theoretical capacities of 890 and 716 mA h g−1 for Co3O4 and CoO, which can be attributed to the formation of solid electrolyte interphase (SEI) films on the particles during the discharge process

Figure 4. First-cycle discharge–charge curves of A200, A300, and A400.[J. Mater. Chem., 2008, 18, 4397-4401]
The long characteristic plateau around 1.0 V observed in the first discharge curves is associated with the conversion reaction: Co3O4 + 8Li+ + 8e− → 4Li2O + 3Co, which has a theoretical capacity of 890 mA h g−1. The following sloping region might be attributed to the formation of surface polymeric layer, which in general contributes to additional capacity. For A200 and A300, the first discharge capacity is about 1290 mA h g−1 with a contribution of about 900 mA h g−1 from the plateau region (corresponding to the insertion of about 8 Li per formula unit). While for A400, the first discharge capacity is only about 1055 mA h g−1. As can be seen, this lower capacity is mainly due to the reduced Li insertion from the plateau region, which might be caused by the crystallite size effect
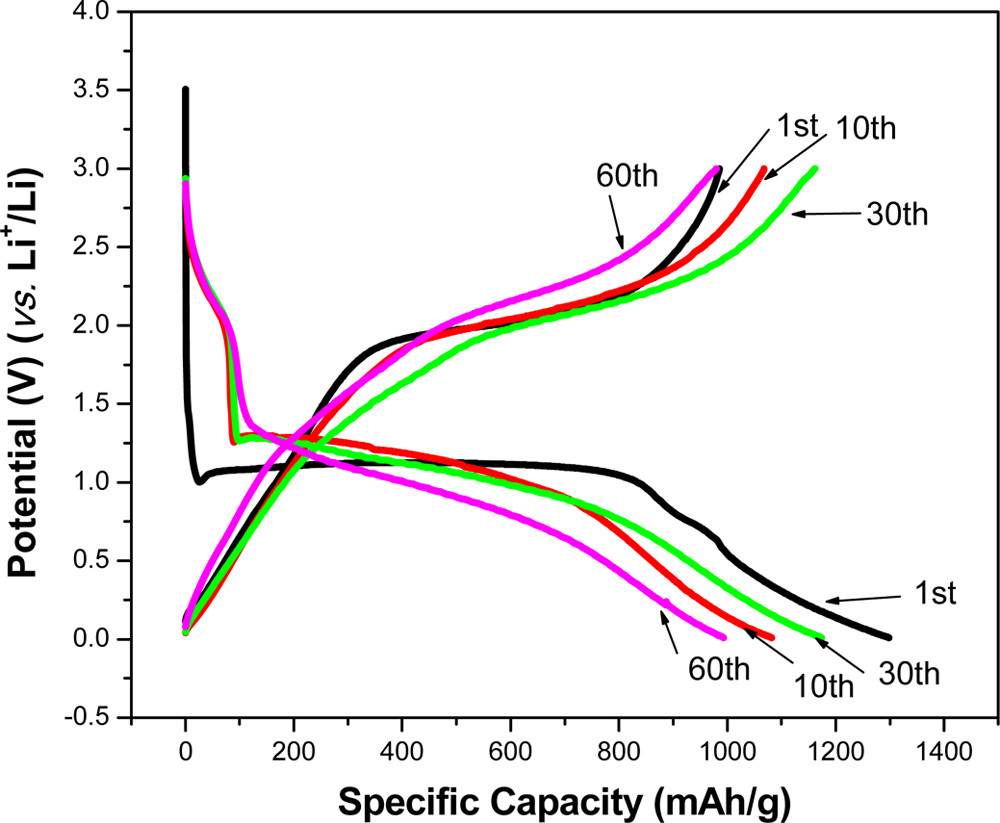
Figure 5. Discharge and charge profiles of Co3O4 electrode in the range of 0.01–3.00 V at the rate of 0.1 C.[ACS Appl. Mater. Interfaces 2014, 6, 10, 7236–7243]
In the first discharge curve, the potential value quickly falls to the plateau (∼1.00 V), which may be ascribed to the conversion from Co3O4 to Co; and then gradually declines to the cutoff voltage (0.01 V), which should be associated with the formation of a polymer/gel-like film on the surface of Co3O4 particles. It is shown that the initial discharge and charge capacities are 1298 mAhg–1 and 986 mAhg–1, respectively, and the irreversible capacity loss may arise from the formation of the SEI film (irreversible reactions) during the first discharge cycle. The following discharge/charge curves tend to be stable, the 10th and 30th cycle processes exhibit similar electrochemical behavior with an approximate charge capacity between 1060 mAhg–1 and 1173 mAhg–1, and then the 60th charge capacity slowly decreases to 980 mAhg–1. All of the capacities as above are larger than its theoretical total capacity (890 mAhg–1), that it is probably caused by the reversible formation/dissolution of the polymer/gel-like film contributing to an additional reversible capacity besides the electrochemical conversion reaction between cobalt oxide and Co
Case 2: Cu3N in Li-Battery
Cu3N reversibly reacts with Li+ via conversion reaction:

The conversion reaction requires a heterogeneous charge transfer at the interfaces, Cu–N bond cleavage and Li+ diffusion in solid state. The kinetics of such reaction is highly dependent on the pristine particle size, even if the reaction is thermodynamically feasible. Thus, smaller particles can favor the reaction

Figure 6. First three cyclic voltammetry scans of the as-obtained Cu3N anode at the scan rate of 0.05 mV/s.[Chem. Mater. 2015, 27, 8282−8288]
The Li insertion starts from a main cathodic peak at 0.58 V corresponding to the conversion reaction with Li. The location of the peak slightly differs from the peaks observed for submicrometer Cu3N particles by Tarascon et al., (32) where the insertion of Li upon the first reduction cycle proceeds mainly in two stages at 0.48 and 0.41 V, respectively. The particle size has significant effect on the working potential of the electrode. The observed potential equals the potential at equilibrium minus the polarization (ohmic and electrochemical). Smaller particle size can largely lower the polarization upon Li insertion; therefore, the observed voltage toward Li reaction for Cu3N in our study is slightly higher than the one for larger particles. Finally we can also observe an additional peak at around 0 V on the cyclic voltammogram. The origin of this peak is still not clear. This extra feature is always much more pronounced for small nanoparticles, which might be associated with (a) polymeric/gel-like film formation on the surface of nanoparticles, which is rooted at low potential, (32) (b) intercalation of Li into carbon black, or (c) the microstructure of the electrode that possesses mesoporosity. Upon delithiation, two weak and broad peaks appear at ∼1.2 and ∼2.4 V, respectively. The peak at 1.2 V is similar to that for the oxidation of Cu(0) to Cu(I) in the case of Cu3N electrode, and 2.5 V is more associated with oxidation of Cu(0) to Cu(I) in the case of Cu2O. (43) During the second cycle, the reduction peaks shift to 1.86 and 0.77 V, respectively, and on the third cycle, the peak located at 1.86 V shifts to 1.79 V. Evidently, the intensity of the peaks at ∼1.8 V on the second and third cycles is much more pronounced compared to the one of the first cycle. These values agree well with the redox features of Cu2O, suggesting a phase transformation from Cu3N to Cu2O after the first cycle

Leave a comment